
Data Engineering & Analytics
Bring your data
together.
Put it to work.
We connect your data and build reliable pipelines and analytics for clearer business decisions.
Discuss Your ProjectFrom scattered sources to useful insights.
We build the foundations that keep data flowing and the analytics that help your teams use it.
-
Data Integration & Pipelines
Bring data from your applications, databases, and files into a connected flow, with automated updates and checks along the way.
-
Data Platforms & Warehouses
Create a central place to organize and maintain your business data, built around the volume, complexity, and needs of your teams.
-
Data Quality & Governance
Check for missing, duplicate, or inconsistent information, and establish clear rules for ownership, access, and use.
-
Data Modeling & Business Metrics
Turn source data into clear business models and shared definitions, so teams calculate and interpret key metrics consistently.
-
Dashboards & Reporting
Build dashboards and reports around the questions your teams need to answer, with clear views of performance and the details behind it.
-
Self-Service & AI-Ready Data
Prepare documented, structured data that people can explore and that AI tools can use with appropriate access controls.
An example in practice
Different systems. One clear picture.
Bring sales, billing, and customer data together so teams can track performance and investigate the details from one place.
Sources
- Sales CRM
- Billing System
- Customer Platform
Shared data model
- Matched customer records
- Quality checks
- Consistent metric definitions
Revenue Overview
$540,000
| Segment | Revenue |
|---|---|
| Enterprise | $270,000 |
| Mid-market | $180,000 |
| Small business | $90,000 |
| Month | Revenue |
|---|---|
| Jan | $80,000 |
| Feb | $85,000 |
| Mar | $90,000 |
| Apr | $88,000 |
| May | $97,000 |
| Jun | $100,000 |
| Period total | $540,000 |
-
Connected sources
Bring information from different systems into a shared view.
-
Consistent definitions
Apply the same business rules wherever a metric is used.
-
Useful answers
Give teams a clear starting point and the detail to investigate further.
Illustrative example. Tailored to your data sources, business definitions, and reporting needs.
Built with you. Built for confident decisions.
-

Built with you
Review working pipelines and dashboards every two weeks, share feedback, and shape what we build next.
-
Connected to your systems
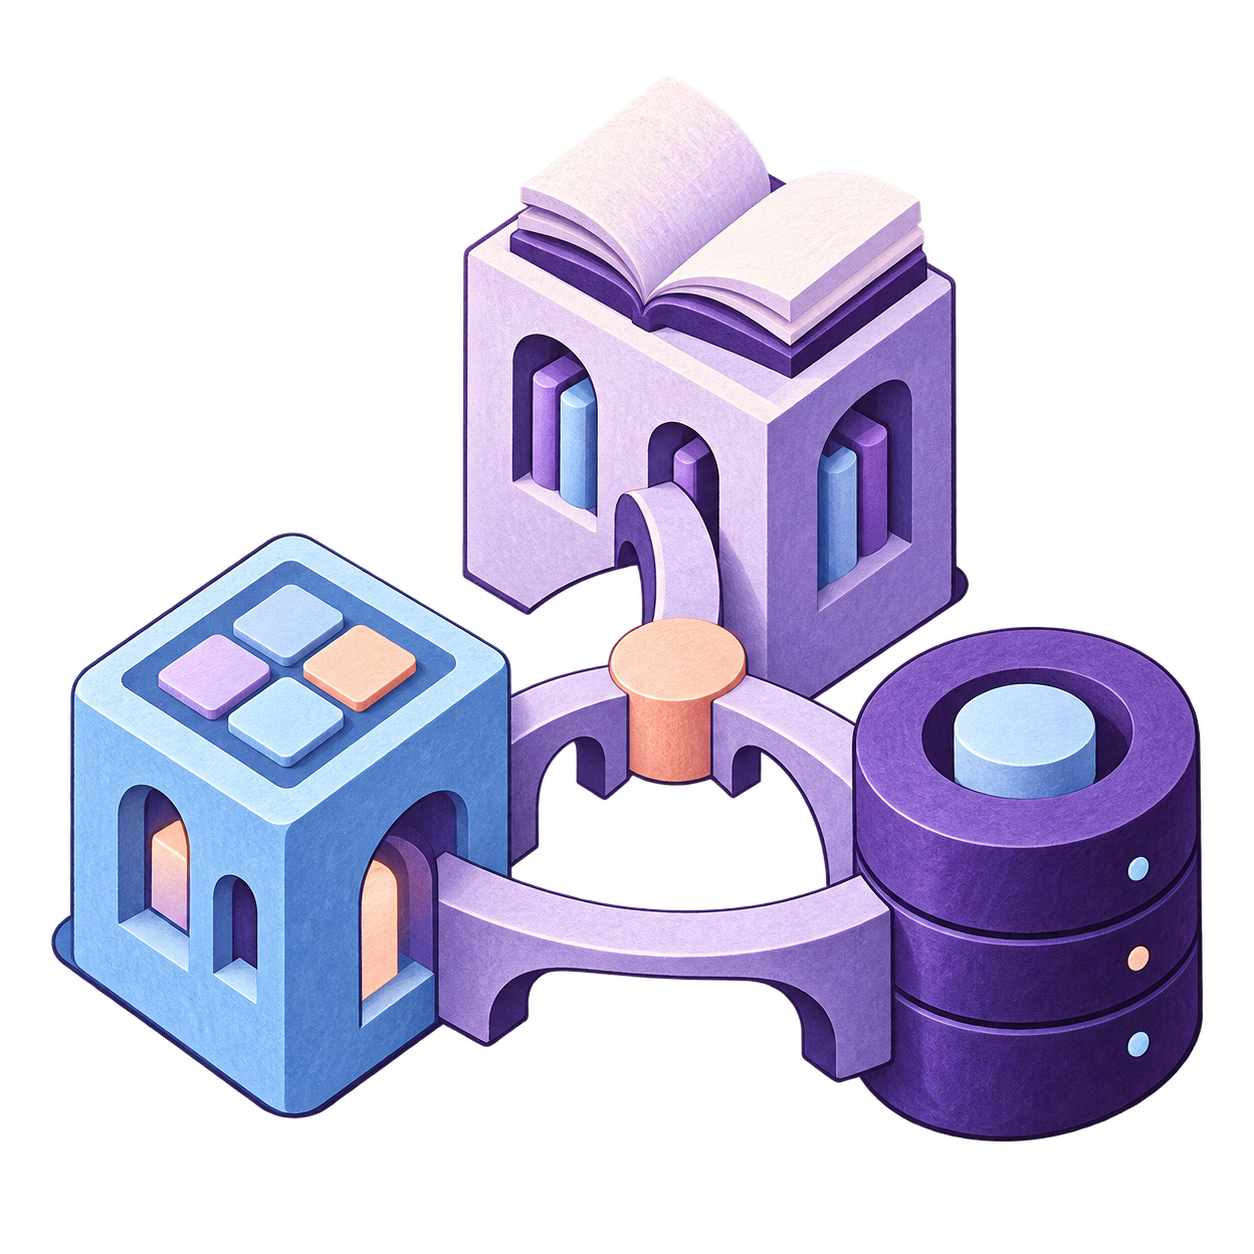
Work with the applications, databases, and platforms you already use, connecting them around your reporting and operational needs.
-
Data you can trust
Build in quality checks, clear definitions, and visibility into data issues so your teams understand the numbers they use.
-

Access with accountability
Define who can view, change, and use data, with permissions and traceability suited to your teams and responsibilities.
From business questions to working analytics.
We work with your team to understand the decisions you need to make, build the data behind them, and bring the results into everyday use.
-
01
Discover & Define
Understand your business questions, review the available data, and agree on priorities, metric definitions, and measures of success.
-
02
Design & Model
Map how data will move and be organized, defining the architecture, quality rules, access controls, and reporting experience.
-
03
Build & Validate
Build pipelines and analytics in two-week increments, checking data against source systems and reviewing results with your team.
-
04
Launch & Improve
Roll out the solution, monitor data flows and quality, and refine the models and reports as your business needs evolve.
What could your data help you do better?
Bring us a reporting bottleneck, disconnected systems, or a business question you struggle to answer. We’ll help define the data foundation and analytics to move you forward.
Discuss Your Project